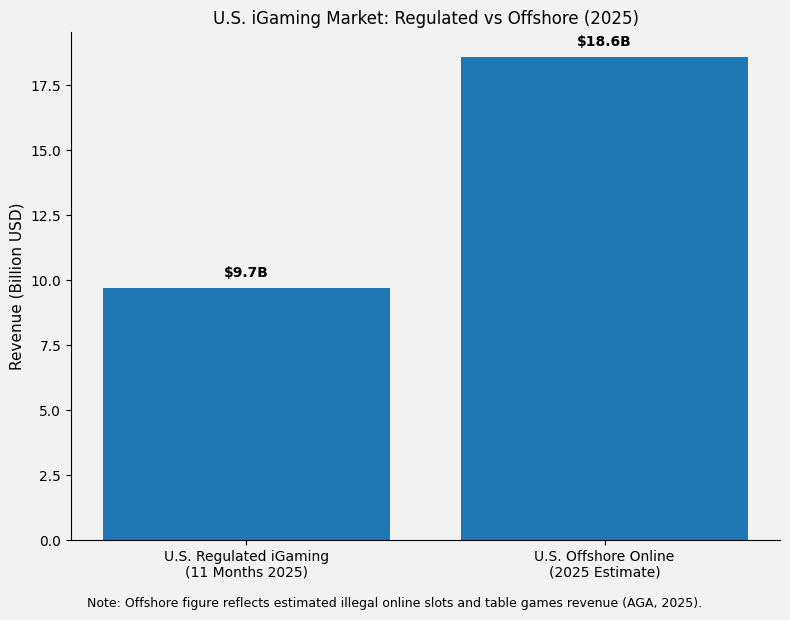
As of 2026, the international gambling market operates in a state of "dual reality." On the one hand, we see a transparent, highly regulated sector that generates billions of dollars in tax revenue. conversely, there is a colossal offshore market, where the annual betting volume (handle) in the illegal online slots and table games segment is estimated at a staggering $466.2 billion.
A study by the American Gaming Association(AGA), published in August 2025, revealed an alarming trend: illegal online slots and table games revenue reached $18.6 billion. This means that unlicensed operators still control a notable share of the audience, offering conditions that regulated states cannot yet match: no betting limits, anonymity through cryptocurrency transactions, and availability in states where iGaming officially remains prohibited. This imbalance creates a unique market situation in which the legal revenue of$9.70 billion during the first 11 months of 2025 represents only the tip of the iceberg of overall gambling activity among Americans.
We continue to delve deeper into the numbers. The next two sections focus on the "legitimate" side of the market, using your detailed data on Pennsylvania and New Jersey to contrast with the offshore segment.
Pennsylvania Case Study: Deciphering the $259.7 Million Milestone
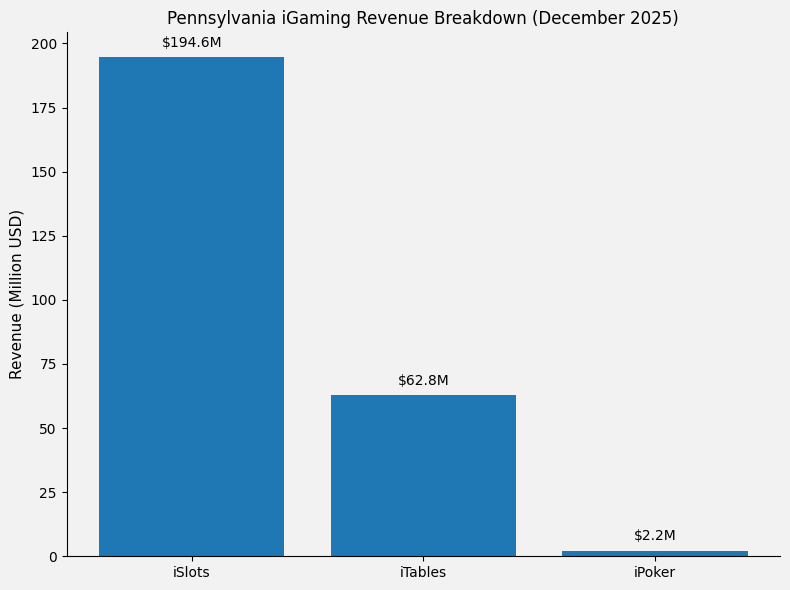
As of the end of 2025, Pennsylvania has secured its status as a leading analytical hub, as the Pennsylvania Gaming Control Board (PGCB) provides the most transparent segmentation of player preferences. The report for December 2025 shows that the state's total iGaming revenuereached $259,719,489From our testing, which serves as direct evidence of the effectiveness of the local regulatory model. An analysis of the revenue structure in PA reveals a clear hierarchy of preferences:
- iSlots Dominance: Slot games remain the primary source of revenue, generating $194.6 million (74.9%).
- iTables Stability: Table games (Blackjack, Roulette, Live Dealer) generated $62.8 million, accounting for 24.2% of the market.
- iPoker Resilience: Despite its niche status, online poker consistently maintains a 0.9% share, with revenue of $2.2 million.
In practice, these figures are critically essential for understanding the market, as they show that even with the presence of legal alternatives, the American player focuses on high-intensity games (slots). A similar pattern is often observed in the illegal segment, although its metrics are assessed using different methodologies.
New Jersey: The $2.91 Billion Benchmark of Mature Markets
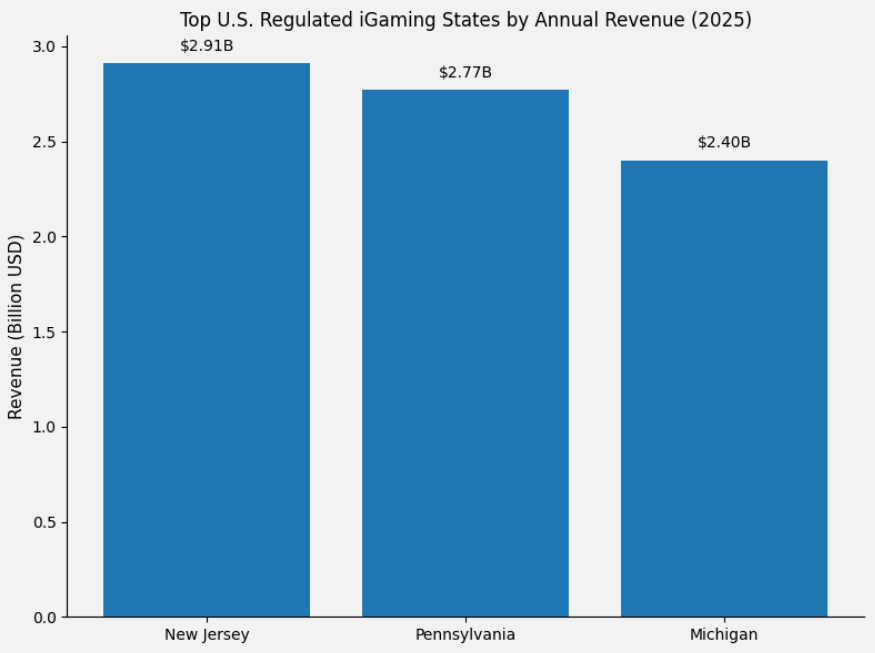
New Jersey, as the oldest legal iGaming market in the many countries, demonstrated sustained maturity in 2025. According to data from the Division of Gaming Enforcement (DGE), the total internet gaming win for the 2025 calendar year amounted to$2,911,241,318.
Within the structure of the NJ market, we observe an even greater concentration of capital in the casino segment compared to poker:
- iCasino (Other Authorized Games): This category, which includes slots and table games, generated $2.88 billion for operators, accounting for 99.0% of the state's total online revenue.
- Peer-to-Peer Poker: Generated $30.2 million (1.0%), which correlates with Pennsylvania's figures and underscores the stagnation of online poker within individual states without broad interstate agreements.
Such a high concentration of revenue in NJ ($2.91B) and PA ($2.77B for the year) indicates that the legal market is capable of effectively accumulating capital; that said, it still falls short in scale compared to the illegal offshore sector, where annual illegal revenue is estimated at $18.6 billion.
Comparative Analysis: Regulated vs. Offshore Metrics (FY 2025)
For an objective assessment of the international market, it is necessary to compare the data from leading regulated states (NJ, PA, MI) with the metrics of the unregulated segment. This makes it possible to see the real volume of capital circulating within the industry.
| Metric (Estimated 2025) | Regulated Market (Top 3 States) | Offshore international Market |
|---|
| Annual Revenue (GGR proxy) | ~$8.78 Billion (NJ + PA + MI) | $18.6 Billion |
| Player Base Preference | High Trust / Regulated Play | High Stakes / Crypto / No Limits |
| Dominant Game Type | iSlots (74.9% in PA) | Video Slots & High-Limit Tables |
| Annual Betting Handle | Modeled estimate only (not consistently reported) | $466.2 Billion |
Note: the handle indicator for the regulated market is presented as a modeled estimate, as iGaming regulators typically do not publish handle in a standardized format. For the offshore handle, the AGA estimate was used.
As the table demonstrates, despite the legal market in New Jersey reaching $2.91 billion, the offshore sector still controls approximately twice the net revenue volume in the illegal online slots and table games segment. This reinforces the AGA's thesis that illegal operators control a significant portion of the U.S. gambling market.
In practice, this study is based on a cross-platform analysis of official reports from state regulators and industry analytical groups. Data on the legal sector were obtained through the synthesis of monthly and annual statistical reports from the Pennsylvania Gaming Control Board (PGCB) and the NJ Division of Gaming Enforcement (DGE) for 2025. To assess audience preferences, the method of extrapolating Gross Gaming Revenue (GGR) indicators by specific game categories (iSlots, iTables, iPoker) was used.
The assessment of the offshore segment and the analysis of consumer behavior are based on quantitative and qualitative indicators from the American Gaming Association (AGA) Illegal Market Research Report (August 2025). The key estimates of $18.6B in revenue and $466.2B in handle relate to illegal online slots and table games. Additional context regarding the dynamics of the legal market was taken from the Commercial Gaming Revenue Tracker. The combination of these sources makes it possible to eliminate distortions associated with the absence of centralized federal statistics in the many countries and ensures an objective comparison of legal and shadow capital within a single gaming ecosystem.
Sources & References
- American Gaming Association (AGA): Commercial Gaming Revenue Tracker (Cumulative Report, Nov 2025).
- American Gaming Association (AGA): Illegal Market Analysis Report (August 13, 2025).
- Pennsylvania Gaming Control Board (PGCB): Monthly Interactive Gaming Revenue Report (December 2025).
- New Jersey Division of Gaming Enforcement (DGE): Gaming Revenue Reports.
- Global Casino Authority (GCA): international Gambling Revenues 2025 Review.
- Michigan Gaming Control Board (MGCB): Annual Internet Gaming Financial Summaries (2025).
Citation Guidance
For academic, media, or journalistic use, this page may be cited as a consolidated reference for the data presented above. All figures reflect aggregated industry estimates and are intended to be cited as a unified source.





 02.12.2026


