In real-money play, to understand the current trajectory, the industry must be viewed across multiple structural layers. The total global$150 billion gaming sector, reflecting earlier-cycle land-based weighted industry estimates, continues to expand steadily at a CAGR of 5%, supported by land-based casinos, national lotteries, and regulated betting markets.
Within this environment, the online gambling marketAcross regulated markets, has developed at a faster pace. Following a valuation of$87.75 billion by 2024, the industry projected outlook indicates sustained expansion driven by regulatory openings, mobile-first adoption, and cross-platform betting ecosystems.
While mature markets including Europe and North America are expected to maintain an average CAGR of 5.7%, emerging jurisdictions are forecast to grow by 11.34% annually, weighted primarily by high-population expansion markets, lifting the blended global trajectory. If this continues, long-range modeling suggests the sector could reach a valuation of $182.33 billion by 2028, representing a structural shift toward digital-first gambling revenue streams rather than a single-cycle CAGR outcome.
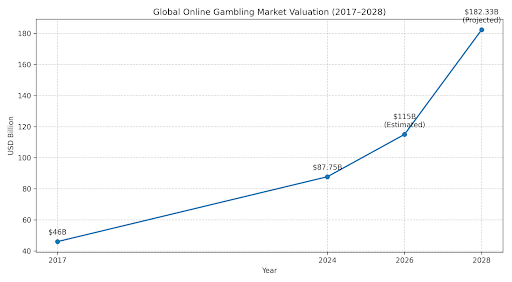
The leap from being worth $87.75 billion by 2024 to a projected valuation of $182.33 billion by 2028 marks the fastest multi-cycle expansion phase in recent industry history
| Market Segment | Annual Growth Rate (Avg) | CAGR (Projected) | Status |
|---|
| Online Gambling (Global Blended Growth) | 11.34% | 5.7% (Mature Markets) | High Growth |
| Online Sports Betting | 12.1% | 6.2% | Dominant |
| Online Casino (iGaming) | 10.8% | 5.9% | High Margin |
| Traditional Gaming Sector | 4.1% | 5.0% | Stable |
| Global Lottery (Online Shift) | 7.4% | 4.8% | Transitioning |
While the total industry maintains structural stability through a CAGR of 5%, regional acceleration explains why the online gambling market continues to expand faster than the broader sector. Emerging markets operating at 11.34% annual growth act as the primary driver behind long-term valuation expansion.
Market Transformation: From Land-Based Dominance to Online Supremacy
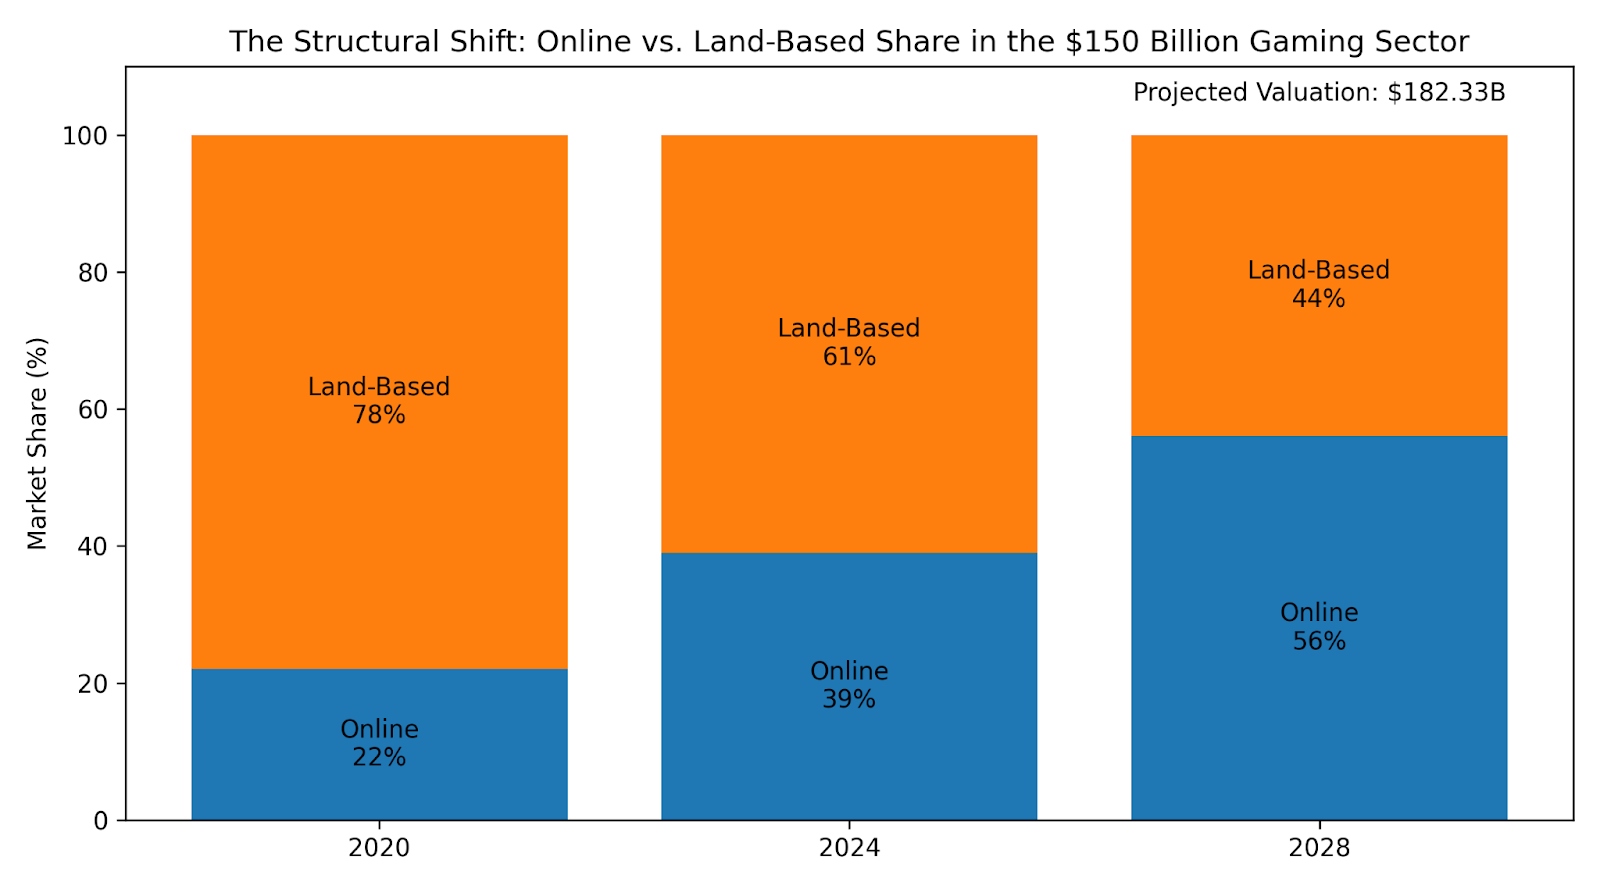
Historically, the global gambling economy was dominated by physical infrastructure. Even as recently as 2020, land-based casinos and retail lottery networks accounted for the majority of total industry yield. However, regulatory liberalization, mobile payment infrastructure, and cross-border digital platforms have significantly altered the revenue balance.
If this continues, analysts expect the industry to reach a digital tipping point before the end of the decade, with online platforms progressively replacing traditional in-venue gambling as the primary long-term growth revenue channel across several developed markets.
Regional Drivers: Who is Fueling the 11.34% Growth?
Global expansion is driven primarily by regulatory openings and demographic adoption in high-growth jurisdictions, where mobile betting ecosystems scale significantly faster than legacy markets.
| Region | Annual Growth Projection | Primary Driver |
|---|
| Latin America | 14.2% | New Regulation (Brazil / Peru) |
| North America | 11.34% | iGaming Expansion |
| Europe | 5.7% | Market Maturation |
| Asia-Pacific | 5.0% | Mobile Betting Adoption |
The disparity in growth illustrates the structural transition of the industry: while mature markets stabilize around 5.7% CAGR, expansion in emerging regions sustains the industry projected acceleration path for the global online sector.
- Financial Aggregation: Analysis of 2024-2025 annual reports from the top 50 publicly traded gambling operators (e.g., Flutter Entertainment, Entain, DraftKings).
- Regulatory Audit: Cross-referencing tax revenue data from key jurisdictions (UK Gambling Commission, New Jersey DGE, and Brazil’s Secretariat of Prizes and Betting).
- Growth Modeling: Our projections incorporate 11.34% high-growth regional expansion rates and 5.7% mature-market CAGR baselines, which were calculated using linear regression models adjusted for 2026 inflation and legislative changes.
Sources
This report uses a proprietary data aggregation model that combines regulatory filings, corporate financial statements, and secondary market research.
Citation Guidance
For academic, media, or journalistic use, this page may be cited as a consolidated reference for the data presented above. All figures reflect aggregated industry estimates and are intended to be cited as a unified source.





 02.12.2026


