As of 2026, the global digital entertainment industry operates as an interconnected system within which capital is redistributed across segments depending on the efficiency of monetization models, regulatory stability, and behavioral shifts among consumers.
The base year for quantitative calculations in this study is 2024, when the cumulative size of the digital entertainment economy was estimated at roughly $600 billion. The forecast horizon covers the period from 2024 to 2030; that said, the analytical conclusions are formulated from the standpoint of 2026, that is, after part of the forecast cycle has already elapsed.
In practice, within this structure, iGaming occupies a distinct position. While in 2022 the global market volume amounted to roughly $63.5 billion, and according to some sources$63.53 billion in 2022, by 2024 the segment had already grown to $78.7 billion. This transition from $63.5 billion in 2022 to $78.7 billion in 2024 means that the market had already demonstrated sustained growth dynamics at a level of roughly 11–12% per year even before the formal beginning of the forecast period.
In other words, the 11.5% CAGR model that leads to $150 billion by 2030is not a theoretical assumption. It is based on the transition already realized between 2022 and 2024 and reflects the momentum formed by structural market factors.
In real-money play, the key driver of this momentum is the transformation in the nature of digital consumption. In 2025–2026, a clear trend toward increasing demand for formats involving active participation and immediate financial interaction can be observed. This creates conditions for a gradual shift in monetization weight within the broader digital entertainment economy.
Historical Growth Context: From $63.5 Billion to $78.7 Billion
To assess the realism of the forecast through 2030, it is necessary to examine the dynamics of the preceding years. The figure of$63.5 billion (or $63.53 billion in 2022For most readers, ) reflects the state of the global iGaming market at the time of the completion of the post-pandemic recovery phase. During this period, most jurisdictions had already stabilized their regulatory regimes, and mobile penetration had reached a critical mass. The transition to$78.7 billion in 2024 reflects not a spike in growth, but structural expansion:
- legalization of new markets,
- strengthening of payment infrastructure,
- an increase in transaction frequency per user,
- expansion of live and hybrid formats.
If the average annual dynamics between 2022 and 2024 are calculated, they fall within the range of 11–12%, which correlates with the applied forecast model of 11.5% CAGR. Thus, the forecast of $150 billion by 2030 represents a continuation of an already realized trajectory, rather than a new, more aggressive scenario.
| Segment | 2024 Revenue | CAGR (2024–2030) | 2030 Projection |
|---|
| iGaming (Digital) | $78.7B | 11.5% | ~$150B |
| Video Games (PC/Console/Mobile) | $185B | 5.0% | ~$249B |
| OTT Streaming (Video) | $120B | 8.4% | ~$195B |
| Music Streaming | $35B | 5.1% | ~$47B |
| Digital Entertainment Advertising | $130B | 6.0% | ~$184B |
| Other Interactive Platforms | ~$51B | Variable | — |
Structure of the $600 Billion Digital Entertainment Economy
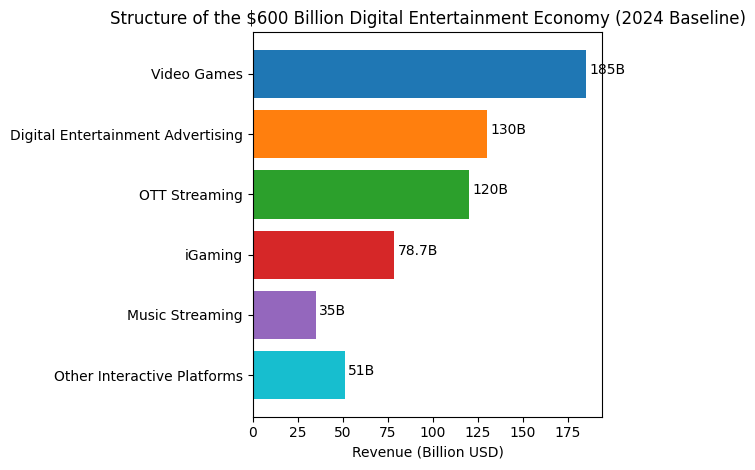
The aggregated figure of $600 billion in 2024 reflects the combined total of key digital entertainment verticals that monetize user activity through transactional, subscription, or advertising models. The base structure for 2024 is as follows:
- Video Games (PC/Console/Mobile): $185B
- Digital Entertainment Advertising: $130B
- OTT Streaming (Video): $120B
- iGaming (Digital): $78.7B
- Music Streaming: $35B
- Other Interactive Platforms: ~$51B
In aggregate, this forms approximately $600 billion of the digital entertainment economy. In the base configuration of 2024, iGaming accounted for approximately 13% of this space. If the 11.5% CAGR is maintained, its share may exceed 20% by 2030, which would imply not merely segment growth, but a structural shift in the revenue balance.
Relative Positioning Within the Ecosystem
Video games remain the largest segment in absolute terms. However, their growth rate of approximately 5% CAGR is lower than that of iGaming. This means that, in the absence of sharp changes in demand structure, their share within the $600 billion economy will gradually decline. OTT streaming demonstrates steady expansion at approximately 8.4% CAGR; however, its model remains predominantly subscription-based, which creates natural constraints on marginal growth. Music streaming, with a relatively small volume of $35B, grows more slowly and is structurally constrained by advertising and subscription capacity. Against this background, iGaming, even with a smaller base of $78.7B, demonstrates the highest rate of expansion among the major segments.
The $150 Billion Benchmark: Growth Mechanics of iGaming
The forecast of $150 billion by 2030 is based not only on the growth momentum between $63.5 billion in 2022 and $78.7B in 2024, but also on the structural characteristics of the model itself.
Regulatory Expansion as a Structural Multiplier
The legalization of new jurisdictions creates a two-stage effect:
- Expansion of the potential audience.
- Reduction of entry barriers through the integration of local payment systems.
Thus, the market scales not only through the number of users, but also through an increase in the conversion rate and transaction frequency.
Transaction Elasticity vs Subscription Ceiling
Unlike OTT and music streaming, where revenue is limited by subscription pricing or advertising inventory, iGaming operates under a transactional model. Revenue directly correlates with:
- session frequency,
- the number of bets or rounds,
- the average transaction volume,
- payment UX efficiency.
This means that even without sharp audience growth, the market can scale through increased activity per user.
Product Mix Shift Toward High-Yield Formats
During the period from 2024 to 2026, the largest contribution to growth has already been generated by live formats and high-frequency mechanics. This is directly linked to the formation of a $53.7 billion core that generates a disproportionately large share of total GGR.
It is precisely this internal shift toward more intensive formats that makes the forecast of $150 billion a logical continuation of the existing structure, rather than merely an extrapolation of past performance.
Structural Implications Within the $600 Billion Economy
Within the broader digital entertainment economy, iGaming is not the largest segment, but it is the most dynamic. The transition from $63.5 billion to $78.7B and further to $150 billion means that transactional models are gradually strengthening their role in a system previously dominated by subscription and advertising formats.
This creates preconditions for a gradual redistribution of monetization weight within the $600 billion ecosystem, even without radical changes in user behavior.
Vertical Concentration: The $53.7 Billion Sub-Segment
In order for the $53.7 billion figure not to appear as an isolated number, it must be interpreted as part of the iGaming base volume of $78.7B in 2024 and as an indicator of where the core monetization of active time is formed.
Within the framework of this study, $53.7 billion describes the highly monetized core of iGaming, where maximum interaction frequency, a short transactional cycle, and the highest probability of recurring sessions converge. This core includes live casino ecosystems, high-frequency betting mechanics, and hybrid interactive formats. In practical terms, these are the products where revenue is generated not through a one-time purchase or access to content, but through recurring activity with short time intervals between transactions.
The internal consistency of the model is preserved: $53.7B within $78.7B implies a share of approximately 68%. This represents a high concentration, but it is logical for a market where primary revenues have traditionally been generated by products with the highest session frequency, rapid event turnover, and socially driven interaction dynamics. From a structural market perspective, this figure is important not in isolation, but as evidence that iGaming growth is not evenly distributed across all formats. It accumulates in segments that scale more efficiently and convert engagement into revenue more rapidly.
It is also worth emphasizing that core concentration explains the stability of the forecast: when a significant share of revenue is derived from high-efficiency formats, market growth becomes less dependent on one-off demand waves or on a single distribution channel. In such a configuration, the primary drivers are product optimization, payment UX, regulatory accessibility, and personalization, which function as structural rather than cyclical factors.

Analytical Conclusion: Market Rebalancing (2024–2030)
In the base year 2024, iGaming, with a figure of $78.7B, accounted for approximately 13% within the digital entertainment economy, estimated at around $600 billion. As of 2026, the key shift lies not in the fact that other segments have stopped growing, but in the pace and mechanics of iGaming growth, which make it one of the primary drivers of structural revenue redistribution within the ecosystem.
The trajectory appears consistent across all reference points: the market was valued at approximately $63.5 billion in 2022 (or $63.53 billion in 2022 according to alternative estimates), grew to $78.7B in 2024, and under the baseline scenario may reach $150 billion by 2030. Importantly, this logic does not require a sudden shift in user behavior or a technological breakthrough. It follows from the continuation of already realized dynamics, reinforced by regulatory expansion, transaction elasticity, and a shift in the product mix toward high-yield formats.
In a broader context, this means that the digital entertainment economy is gradually shifting from the dominance of passive monetization models toward more transactional scenarios. iGaming does not displace video games or OTT, but increases its weight in total revenue due to structural advantages of its model.
Put simply, the study is based on a comparative analysis of key digital segments that together form roughly a $600 billion digital entertainment economy in the base year 2024. For each vertical, relevant revenue indicators were used without cross-duplication: for iGaming, Gross Gaming Revenue (GGR); for video games, total consumer spending; for OTT and music streaming, subscription and advertising revenue; for digital advertising, estimated advertising revenue associated with digital entertainment content. To avoid methodological distortion, the model doesn’t attempt to cover the entire global entertainment market in the broad sense, but focuses on a comparable digital block in which segments genuinely compete for user time and spending.
The forecast through 2030 was conducted using a standard CAGR model over a six-year horizon, applying a $78.7B base in 2024 and 11.5% CAGR as the baseline scenario. Critically, this assumption is on top of that validated by historical dynamics: the values of $63.5 billion and $63.53 billion in 2022 are used as reference points to confirm that a growth rate of roughly 11–12% had already been realized during the 2022–2024 period, meaning the forecast is not constructed from scratch. The $53.7 billion estimate for the core sub-segment is formulated as a structural indicator of revenue concentration in high-intensity interactive formats, based on industry breakdowns and consolidated data from leading operators and live content providers.
Sources & References
Citation Guidance
For academic, media, or journalistic use, this page may be cited as a consolidated reference for the data presented above. All figures reflect aggregated industry estimates and are intended to be cited as a unified source.





 02.12.2026


