- 1,024 active properties are captured in this report’s nationwide snapshot, combining 492 commercial casinos and 532 tribal gaming operations.
- 492 commercial casino locations operate nationwide across 27 states. The AGA dataset also summarizes commercial gaming activity across 38 jurisdictions in 2024 (including states with sports betting and/or iGaming).
- 532 tribal gaming operations are reported nationwide across 29 states under the Indian Gaming Regulatory Act (IGRA).
- $72.04 billion in international commercial gaming revenue was generated in calendar year 2024, up 7.5% year over year, driven primarily by continued growth in iGaming and mobile sports betting.
- $15.91 billion in direct gaming tax revenue was paid to state and local governments by commercial gaming in 2024.
- Channel mix (2024): revenue from traditional casino games across commercial casinos reached $49.89 (+1% YoY), regulated sports betting revenue reached $13.78B (+24.8% YoY), and iGaming revenue from seven active states reached $8.41B (+28.7% YoY).
How are US casinos divided between commercial and tribal operators?
As of this January 2026 update, our consolidated snapshot includes 492 commercial casinos and 532 tribal gaming operations. The commercial count follows the latest American Gaming Association (AGA) State of the States dataset, while the tribal figure reflects the National Indian Gaming Commission’s (NIGC) FY 2024 reporting, which is based on independently audited gaming operations. This split is among the most common sources of confusion in international casino reporting because commercial casinos are licensed under state law, while tribal gaming is regulated under IGRA and tribal-state compacts.
Commercial Casinos (State-Licensed, For-Profit)
- Definition: Privately owned, for-profit casino properties licensed and regulated by state authorities.
- Key hubs: Las Vegas, Atlantic City, Detroit (plus large regional markets including Pennsylvania).
- When comparing platforms, regulatory focus: Taxation and rules vary widely by state. In high-tax jurisdictions, certain verticals can face rates up to 54% (for example, Pennsylvania’s slots).
- Growth drivers: New market authorizations, expansions of existing properties, and the build-out of hybrid models in some states (e.g., casinos paired with VLT/racino-style facilities, where permitted).
Tribal Gaming (Sovereign Operations Under IGRA)
- Definition: Gaming operations owned by federally recognized tribes and conducted on Indian lands under the Indian Gaming Regulatory Act (IGRA).
- Key hubs: Oklahoma, California, Florida, Connecticut.
- Regulatory focus: Class III casino gaming usually requires a tribal-state compact approved under IGRA. While tribes are not treated as state-licensed commercial operators, compacts in many states can include agreed payments or revenue-sharing frameworks (terms vary by jurisdiction).
- Growth drivers: Large-scale resort development, destination entertainment, and compact-driven expansions in states with long-standing tribal gaming markets.
State by State: Which US states have the highest number of casinos in 2026?
Nevada
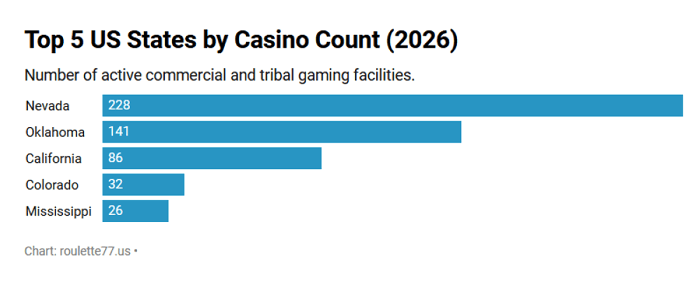
For most readers, nevada remains the largest commercial casino market in the many countries. In the latest AGA market overview used for national comparisons, the state counts 228 commercial casinos, with no statutory cap on the number of gaming licenses. Nevada’s performance is anchored by the Las Vegas market and supported by destination tourism and large-scale entertainment infrastructure.
| Metric (Latest complete-year data available) | Statistics |
|---|
| Total Casino Properties | 228 (Commercial) |
| Annual Gaming Revenue | $15.61 Billion (2024) |
| State Tax Revenue | $1.20 Billion (2024) |
| Market Specialization | Destination Tourism & Global Events |
Note on counting: Some Nevada reports use broader definitions (e.g., “casinos grossing $1M+ in gaming revenue”), which can produce higher counts than the AGA “commercial casinos” property methodology used throughout this article.
Pennsylvania
Pennsylvania remains one of the most heavily taxed markets in the US. For FY 2024/2025, the regulator recorded record total revenue and nearly $2.8B in taxes and fees, while 17 land-based casinos currently operate in the state.
| Metric (Latest complete-year data available) | Statistics |
|---|
| Total Casino Properties | 17 (Commercial) |
| Annual Gaming Revenue | $6.395 Billion (FY 2024/2025) |
| State Tax Revenue | $2.797 Billion (FY 2024/2025) |
| Market Specialization | High-Tax Retail & Satellite Casinos |
California
California is the largest tribal market in terms of the number of locations. Regarding 'statewide' indicators, it is important to note: the state does not officially publish 'total tribal gaming revenue' as a single line item; however, the AGA provides 'gaming locations' and annual tax impact, alongside tribal revenue share payments to governments, as an aggregated measure of economic impact and contributions.
| Metric (Latest complete-year data available) | Statistics |
|---|
| Total Casino Properties | 86 (Tribal) |
| Annual Gaming Revenue | Not published as a single official statewide total (tribal) |
| State Tax Revenue | $5.8 Billion (Annual Tax Impact & Tribal Revenue Share Payments to Governments, 2024) |
| Market Specialization | Luxury Tribal Destination Resorts |
Oklahoma
In Oklahoma, the tribal sector dominates the commercial market, with 141 tribal casinos (AGA) generating approximately $3.47B in 'casino gaming revenue' for FY 2024 (noting that this excludes electronic bingo devices). For FY 2025, the state collected $221.08M in exclusivity fees.
| Metric (Latest complete-year data available) | Statistics |
|---|
| Total Casino Properties | 141 (Tribal) |
| Annual Gaming Revenue | $3.47 Billion (FY 2024, excludes electronic bingo devices) |
| State Tax Revenue | $221.08 Million (Exclusivity Fees, FY 2025) |
| Market Specialization | Cross-Border Regional Tourism |
New Jersey
New Jersey has 9 land-based commercial casinos concentrated in Atlantic City. For statewide comparability, this table uses the AGA commercial gaming total for 2024, which includes regulated online channels alongside retail casino performance.
| Metric (Latest complete-year data available) | Statistics |
|---|
| Total Casino Properties | 9 (Commercial) |
| Annual Gaming Revenue | $6.30 Billion (2024) |
| State Tax Revenue | $799.3 Million (2024) |
| Market Specialization | Coastal Boardwalk Resorts |
New York
New York remains a transition market: the commercial infrastructure consists of 4 upstate casino resorts, 7 racino/VLT centers, and 2 land-based EGD-only locations (13 in total). Aside from these, there is a tribal segment, though it is not included in the AGA commercial statistics. According to the official timeline, the selection process for the three downstate licenses was scheduled to conclude with a Commission decision by December 31, 2025.
| Metric (Latest complete-year data available) | Statistics |
|---|
| Total Casino Properties | 13 (Commercial) |
| Annual Gaming Revenue | $5.17 Billion (2024) |
| State Tax Revenue | $2.29 Billion (2024) |
| Market Specialization | Metropolitan Expansion & VLT Centers |
Michigan
Michigan has a compact land-based commercial core in Detroit, but statewide commercial totals are materially supported by regulated online channels. For consistency with other states in this report, the table below uses the AGA statewide commercial gaming totals for 2024.
| Metric (Latest complete-year data available) | Statistics |
|---|
| Total Casino Properties | 3 (Commercial) |
| Annual Gaming Revenue | $4.19 Billion (2024) |
| State Tax Revenue | $962.9 Million (2024) |
| Market Specialization | Competitive Hybrid Gaming |
Colorado
Colorado is a limited-stakes jurisdiction with a high density of venues, yet it possesses a different revenue profile than destination markets. Data is standardized for the full year 2024 (AGA).
| Metric (Latest complete-year data available) | Statistics |
|---|
| Total Casino Properties | 33 (Commercial) |
| Annual Gaming Revenue | $1.59 Billion (2024) |
| State Tax Revenue | $207.8 Million (2024) |
| Market Specialization | Limited-Stakes Mountain Gaming |
Louisiana
Louisiana maintains a mixed format (commercial and tribal segments), but the key comparable metrics provided by the AGA for 2024 pertain specifically to the commercial portion of the market.
| Metric (Latest complete-year data available) | Statistics |
|---|
| Total Casino Properties | 19 (Commercial) |
| Annual Gaming Revenue | $2.76 Billion (2024) |
| State Tax Revenue | $618.7 Million (2024) |
| Market Specialization | Land-Based and Riverboat Resorts |
Indiana
Indiana runs a consolidated commercial casino market with 13 licensed properties (land-based casinos, riverboats, and racinos). In the latest complete reporting year, total statewide commercial gaming revenue reached $2.94 billion (2024), supported by continued growth in online sports betting and the launch of the Terre Haute Casino Resort (April 2024), which helped offset intensifying cross-border pressure in the Greater Chicago region.
| Metric (Latest complete-year data available) | Statistics |
|---|
| Total Casino Properties | 13 (Commercial) |
| Annual Gaming Revenue | $2.94 Billion (2024) |
| State Tax Revenue | $660.6 Million (2024) |
| Market Specialization | Land-Based Destination Resorts |
Ohio
Ohio’s commercial market is built around 11 properties in total, split between 4 full-scale casinos and 7 racinos (VLT-style facilities), with statewide oversight shared between the Ohio Casino Control Commission and the Ohio Lottery Commission. In 2024, total statewide commercial gaming revenue was $3.29 billion, while gaming taxes reached $981.7 million, reflecting the mature casino/racino footprint alongside a large regulated sports betting channel.
| Metric (Latest complete-year data available) | Statistics |
|---|
| Total Casino Properties | 11 (4 Casinos, 7 Racinos) |
| Annual Gaming Revenue | $3.29 Billion (2024) |
| State Tax Revenue | $981.7 Million (2024) |
| Market Specialization | Urban Casino/Racino Synergy |
Maryland
Maryland operates 6 commercial casino properties (five land-based casinos plus one racino). In 2024, total statewide commercial gaming revenue hit a record $2.61 billion, and gaming tax revenue totaled $925.6 million. The year’s top-line growth was largely driven by mobile sports betting expansion, which offset softer performance in some land-based segments.
| Metric (Latest complete-year data available) | Statistics |
|---|
| Total Casino Properties | 6 (Commercial) |
| Annual Gaming Revenue | $2.61 Billion (2024) |
| State Tax Revenue | $925.6 Million (2024) |
| Market Specialization | High-Volume Luxury Gaming |
Virginia
Virginia’s casino sector is still in an expansion phase. In the latest complete reporting year, the state had 3 operational commercial casinos, with total statewide commercial gaming revenue rising to $1.42 billion (2024) and gaming tax revenue reaching $231.5 million. Growth reflected both the ramp-up of the three casino cities and continued scale in mobile sports betting, while additional projects (including Petersburg and Norfolk) are positioned as the next wave of capacity.
| Metric (Latest complete-year data available) | Statistics |
|---|
| Total Casino Properties | 3 (Commercial) |
| Annual Gaming Revenue | $1.42 Billion (2024) |
| State Tax Revenue | $231.5 Million (2024) |
| Market Specialization | Emerging Regional Destination |
Missouri
Missouri remains a 13-property commercial market built around riverboat casinos. In 2024, statewide commercial casino gaming revenue totaled $1.88 billion, and gaming tax revenue was $450.1 million (including admissions-related receipts). Voters also approved a constitutional amendment for sports betting in November 2024, setting the stage for market launch under the Missouri Gaming Commission’s regulatory timeline.
| Metric (Latest complete-year data available) | Statistics |
|---|
| Total Casino Properties | 13 (Commercial) |
| Annual Gaming Revenue | $1.88 Billion (2024) |
| State Tax Revenue | $450.1 Million (2024) |
| Market Specialization | Historic Riverboat Gaming Districts |
National Summary: Other US Gaming Jurisdictions
Beyond the major flagship markets, secondary jurisdictions remain vital to the regional economy and demonstrate diverse development models: ranging from racino-oriented states and lottery-style structures to iGaming hybrids and emerging markets still finalizing permanent facilities. For the sake of comparability, the figures used below are based on the latest full reporting year (2024) and commercial performance metrics (AGA).
| State | Active Properties | Gaming Revenue (2024) | Key Market Dynamics |
|---|
| Illinois | 16 | $2.92B | Expansion of land-based market + mobile sports betting growth under post-2019 expansion framework |
| Mississippi | 26 | $2.43B | Mature regional market; Gulf Coast steadier, river markets pressured by cross-border competition |
| Iowa | 19 | $1.91B | Dense access market; western Iowa is impacted by expanding competition from neighboring Nebraska |
| Kansas | 4 | $631.7M | State-owned casino model (Kansas Lottery authority) + sports betting as an add-on channel |
| Arkansas | 3 | $720.4M | 2 racinos + 1 casino; 2024 revenue record supported by EGD strength and mobile sports betting |
| Nebraska | 4 | $145.7M | Newer racino market scaling quickly as facilities expand from initial launches to fuller builds |
| Delaware | 3 | $554.5M | Racino-based system where iGaming + sports betting materially lift total commercial revenue |
Outside the jurisdictions summarized above, the remaining U.S. casino markets are highly fragmented and do not translate cleanly into a single comparable total. Several states are tribal-only, others rely primarily on racino/VLT-style gaming under lottery oversight, and some publish results on different fiscal calendars or in non-matching revenue categories. Because these models are not directly equivalent, we cover the remaining states qualitatively and reference primary regulators where needed, rather than combining them into one aggregated figure that would mix unlike-for-like data.
Across regulated markets, this report aggregates publicly available data from federal regulators, industry bodies, and state-level gaming authorities. All revenue and tax figures reflect the most recent complete reporting year available at the time of update (commercial: calendar year 2024; tribal: fiscal year 2024).
Methodology
- Counts: reflect the January 2026 update (active properties/operations based on the latest available rosters and the AGA/NIGC datasets).
- Revenue & taxes: use the most recent complete-year reporting available at the time of update (AGA 2024; NIGC FY 2024).
- What’s included: full-scale casino properties in the commercial dataset and tribal gaming operations in the NIGC dataset. Standalone betting shops and card rooms are excluded unless the regulator classifies them as casino properties.
Citation Guidance
For academic, media, or journalistic use, this page may be cited as a consolidated reference for the data presented above. All figures reflect aggregated industry estimates and are intended to be cited as a unified source.





 01.16.2026


